Attribution refers to the set of rules that determine which ad gets credit for a sale or a conversion. The rise of the Internet allowed marketers to track user interactions throughout the entire customer journey but most advertisers still attribute 100% of conversions to the last touch channel or the last ad that the user clicked before converting.
Data-Driven Attribution
To more accurately depict the contribution of each touchpoint to the conversion, a more mathematically robust method of attribution must be applied. One way is to use a Markov chain model to represent the possible customer journeys. Markov chains show the possible touchpoint transitions as probabilities based on the current touchpoint. Markov chains also make it easier to compute the probability of conversion from the start of the journey by summing the probabilities of conversion across all possible paths.
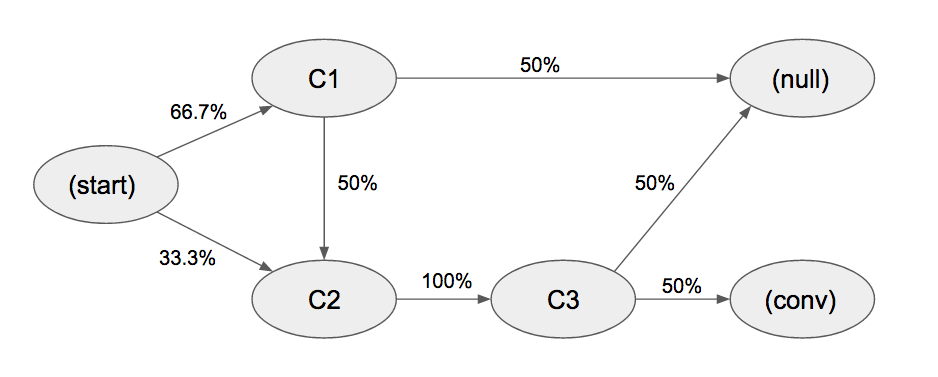
Sergey Bril discussed how to run data-driven channel attribution analysis using R on his website. In this article, I will show how to perform data-driven channel attribution analysis using Python. For illustrative purposes I will reuse the sample problem presented in Sergey Bril’s original article. The sample Markov chain representing possible customer journeys is shown below:
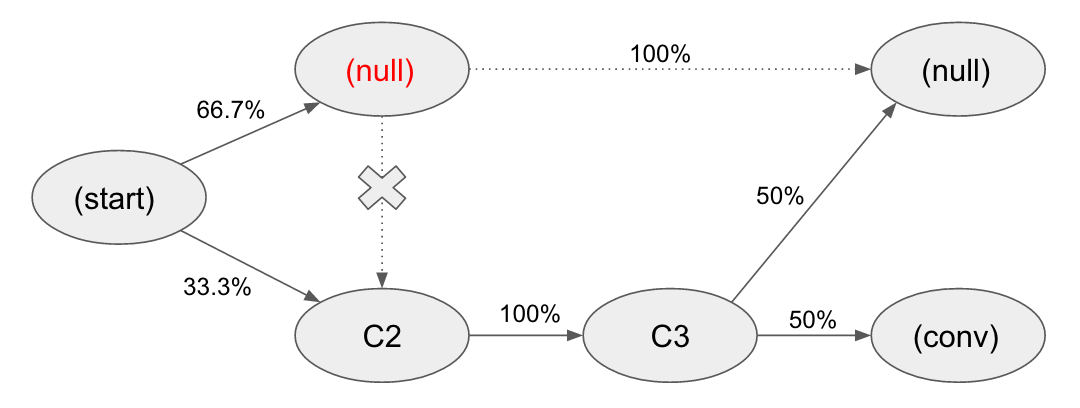
Data-driven attribution is calculated by measuring the removal effect. The removal effect for a touchpoint is the decrease in conversion probability if the touchpoint is “removed” or if we assume that all users who visit the removed touchpoint will not convert.
I will use Python to solve the sample attribution problem which Sergey Bril discussed on his website. This solution does not use specialized libraries and instead implements the mathematics of multi-channel attribution directly onto a Pandas dataframe. The original problem can be found here.
The full notebook with Python code follows while an interactive version may be found on Colab here.
Data-Driven Attribution in Python
Start by importing libraries.
# Import libraries
import pandas as pd
import numpy as np
Define some dummy data.
# Define data
data = pd.DataFrame(np.array([[1, 'start', 1, 0],
                              [1, 'c1', 2, 0],
                              [1, 'c2', 3, 0],
                              [1, 'c3', 4, 0],
                              [1, 'purchase', 5, 1],
                              [1, 'start', 6, 0],
                              [1, 'c1', 7, 0],
                              [1, 'unsuccessful', 8, 0],
                              [2, 'start', 9, 0],
                              [2, 'c2', 10, 0],
                              [2, 'c3', 11, 0],
                              [2, 'unsuccessful', 12, 0]]),
                    columns=['customer_id',
                             'touchpoint',
                             'time',
                             'conversion'])
# Clean data
data['time'] = pd.to_numeric(data['time'], errors='coerce')
data['touchpoint'] = data['touchpoint'].str.lower()
Preview the data.
# Preview data
data
| customer_id | touchpoint | time | conversion | |
|---|---|---|---|---|
| 0 | 1 | start | 1 | 0 |
| 1 | 1 | c1 | 2 | 0 |
| 2 | 1 | c2 | 3 | 0 |
| 3 | 1 | c3 | 4 | 0 |
| 4 | 1 | purchase | 5 | 1 |
| 5 | 1 | start | 6 | 0 |
| 6 | 1 | c1 | 7 | 0 |
| 7 | 1 | unsuccessful | 8 | 0 |
| 8 | 2 | start | 9 | 0 |
| 9 | 2 | c2 | 10 | 0 |
| 10 | 2 | c3 | 11 | 0 |
| 11 | 2 | unsuccessful | 12 | 0 |
# Sort data and reindex
data = data.sort_values('time')
data = data.reset_index()
data
| index | customer_id | touchpoint | time | conversion | |
|---|---|---|---|---|---|
| 0 | 0 | 1 | start | 1 | 0 |
| 1 | 1 | 1 | c1 | 2 | 0 |
| 2 | 2 | 1 | c2 | 3 | 0 |
| 3 | 3 | 1 | c3 | 4 | 0 |
| 4 | 4 | 1 | purchase | 5 | 1 |
| 5 | 5 | 1 | start | 6 | 0 |
| 6 | 6 | 1 | c1 | 7 | 0 |
| 7 | 7 | 1 | unsuccessful | 8 | 0 |
| 8 | 8 | 2 | start | 9 | 0 |
| 9 | 9 | 2 | c2 | 10 | 0 |
| 10 | 10 | 2 | c3 | 11 | 0 |
| 11 | 11 | 2 | unsuccessful | 12 | 0 |
The following code block defines the touchpoints class to load the touchpoint data into and also defines methods to analyze the touchpoint interaction data.
class touchpoints:
    def __init__(self, data, touchpoints, start, time, conversion, nonconversion, user_ids):
        # Define variables
        self.data = data
        self.touchpoints = touchpoints
        self.start = start
        self.conversion = conversion
        self.nonconversion = nonconversion
        self.user_ids = user_ids
        self.time = time

        # Sort data and reindex
        self.data = self.data.sort_values(self.time)
        self.data = self.data.reset_index()

        # Define conversion
        self.data['conversions'] = 0
        self.data.loc[self.data[touchpoints]==self.conversion, 'conversions'] = 1

        # Count conversions
        self.data['conversion_count'] = self.data.groupby('conversions').cumcount()+1
        self.data.loc[self.data['conversions']!=True, 'conversion_count'] = np.nan
        self.data['conversion_count'] = self.data['conversion_count'].fillna(method='bfill')
        self.data['conversion_count'] = self.data['conversion_count'].fillna(self.data['conversion_count'].max()+1)

        # Split into conversion journeys
        self.data['journey_id'] = list(zip(self.data[user_ids], self.data['conversion_count']))


        # Initialize dict for temporary transition matrices and removal effects
        self.temp_trans_matrix = {}
        self.temp_x = {}

    def attribute(self):
        # Get transitions
        self.journeys = pd.DataFrame()
        for journey in self.data['journey_id'].unique():
            # Get transitions for a single user
            temp_journey = self.data.loc[self.data['journey_id']==journey]
            temp_journey['next_'+self.touchpoints] = temp_journey[self.touchpoints].shift(-1)
            self.journeys = self.journeys.append(temp_journey)
        self.journeys = self.journeys.dropna(subset=['next_'+self.touchpoints])

        # Get transition probabilities
        self.states = self.journeys.pivot_table(index=[self.touchpoints],
                                                values='journey_id',
                                                aggfunc=len)
        self.transitions = self.journeys.pivot_table(index=[self.touchpoints, 'next_'+self.touchpoints],
                                                     values='journey_id',
                                                     aggfunc=len)
        self.transitions = self.transitions.reset_index()
        self.transitions = self.transitions.join(self.states, on=self.touchpoints, rsuffix='_total')
        self.transitions['probability'] = self.transitions['journey_id']/self.transitions['journey_id'+'_total']
        self.transitions = self.transitions.sort_values('probability')

        # Get transition matrix
        self.trans_matrix = self.transitions.pivot_table(index=self.touchpoints,
                                                         columns='next_'+self.touchpoints,
                                                         values='probability',
                                                         aggfunc=np.mean,
                                                         fill_value=0)

        # Add missing columns
        for index, row in self.trans_matrix.iterrows():
            if index not in self.trans_matrix.columns:
                self.trans_matrix[index] = 0

        # Add missing rows
        for col in self.trans_matrix.columns:
            if col not in self.trans_matrix.index.values:
                new_row = pd.Series()
                new_row.name = col
                self.trans_matrix = self.trans_matrix.append(new_row)

        # Fill in NAs with zero probabilities
        self.trans_matrix = self.trans_matrix.fillna(0)

        # Reorder columns to solve as linear equations
        self.trans_matrix = self.trans_matrix[self.trans_matrix.index.values]

        # Make sure probabilities sum to 1 (required for next step)
        for index, row in self.trans_matrix[self.trans_matrix.sum(axis=1)<1].iterrows():
            self.trans_matrix.loc[index, index] = 1

        # Set constant term to zero (on RHS)
        self.RHS = np.zeros(self.trans_matrix.shape[0])

        # Set conversion probability at conversion to 1
        self.RHS[self.trans_matrix.index.get_loc(self.conversion)] = 1

        # Make equations' RHS equal the long-run transition probability of that variable to the conversion then subtract from both sides
        for index, row in self.trans_matrix.iterrows():
            if (index != self.conversion) & (index != self.nonconversion):
                self.trans_matrix.loc[index, index] -= 1

        # Solve system of equations
        self.x = np.linalg.solve(self.trans_matrix, self.RHS)

    def attribute_removal(self, remove):
        # Copy transition probability table if it exists or create it if it doesn't
        try:
            self.temp_trans_matrix[remove] = self.trans_matrix.copy()
        except:
            self.attribute()
            self.temp_trans_matrix[remove] = self.trans_matrix.copy()
            pass

        # Set removed touchpoint probabilities to zero except for unsuccessful
        self.temp_trans_matrix[remove].loc[remove] = 0
        self.temp_trans_matrix[remove].loc[remove, self.nonconversion] = 1

        # Make equations' RHS for the removed touchpoint equal the long-run transition probability of that variable to the conversion then subtract from both sides
        self.temp_trans_matrix[remove].loc[remove, remove] -= 1

        # Solve system of equations
        self.temp_x[remove] = np.linalg.solve(self.temp_trans_matrix[remove], self.RHS)

    def limit_touchpoints(self, limit=5):
        # Limit to top 10 domains
        self.data[self.touchpoints] = self.data[self.touchpoints].replace(self.data[self.touchpoints].value_counts().index[limit:], 'Others')
        # Keep conversions
        self.data.loc[self.data['conversions']==True, touchpoints] = 'Conversion'

    def describe_data(self):
        temp_data = self.data.copy()
        temp_data['temp_column'] = self.data.index
        temp_data = temp_data.pivot_table(index='journey_id',
                                          columns=self.touchpoints,
                                          values='temp_column',
                                          aggfunc=len,
                                          fill_value=0)
        print('There are ' + str(temp_data.shape[0]) + ' unique journeys.')
        print('There are ' + str(temp_data.shape[1]) + ' unique touchpoints.')
        print(temp_data)

    def long_term_transition_probability(self):
        # Get conversion probability at start
        conv_prob = self.x[self.trans_matrix.index.get_loc(self.start)]
        return conv_prob

    def removal_rate(self, remove):
        # Get conversion probability at start
        conv_prob = self.x[self.trans_matrix.index.get_loc(self.start)]
        conv_prob_remove = self.temp_x[remove][self.temp_trans_matrix[remove].index.get_loc(self.start)]
        removal_rate = 1 - conv_prob_remove/conv_prob
        return removal_rate
tp_data = touchpoints(data=data,
                      touchpoints='touchpoint',
                      start='start',
                      conversion='purchase',
                      nonconversion='unsuccessful',
                      time='time',
                      user_ids='customer_id')
Calculate the removal rate for touchpoint 1.
# Calculate the removal rate for c1
tp_data.attribute_removal('c1')
Show the long term probability of conversion for the entire Markov chain.
# Show the long term transition probability for the entire Markov chain
tp_data.long_term_transition_probability()
0.3333333333333333
Show the calculated removal rate for touchpoint 1.
# Show the removal rate for c1
tp_data.removal_rate('c1')
0.5
Calculate the removal rates for touchpoints 2 and 3.
# Calculate the removal rate for c2 then c3
tp_data.attribute_removal('c2')
tp_data.attribute_removal('c3')
Show the removal rate for touchpoint 2.
# Show the removal rate for c2
tp_data.removal_rate('c2')
1.0
Show the removal rate for touchpoint 3.
# Show the removal rate for c3
tp_data.removal_rate('c3')
1.0
Interpretation
The removal effect represents the conversions potentially lost if a touchpoint is removed. This is treated as a measure of the touchpoint’s importance - since both c2 and c3 have removal effects of 100% while c1 has a removal effect of only 50%, we can say that both c2 and c3 are twice as important as c1 since their removal effects are twice as large.
| Channel | Removal Effect |
|---|---|
| c1 | 50% |
| c2 | 100% |
| c3 | 100% |
The removal effect can also be used to estimate the number of conversions attributed to each touchpoint. Since we want to base the attribution on the importance of each touchpoint, we distribute the conversions based on each touchpoint’s removal effect. For example, to get the conversions attributed to c1, we need to divide the number of conversions by the sum of the removal effects for all touchpoints and then multiply that value by the removal effect for touchpoint c1 - essentially attributing c1 based on its share of removal effect.
The full conversion attribution for each touchpoint in the sample problem is given below:
| Channel | Removal Effect | Attributed Conversions |
|---|---|---|
| c1 | 50% | 0.2 |
| c2 | 100% | 0.4 |
| c3 | 100% | 0.4 |
Sources:
Anderl, E., Becker, I., Wangenheim, F. V., & Schumann, J. H. (2014). Mapping the customer journey: A graph-based framework for online attribution modeling. Available at SSRN: link or link
Bryl, S. (2018). Marketing Multi-Channel Attribution model with R (part 1: Markov chains concept) - AnalyzeCore by Sergey Bryl’ - data is beautiful, data is a story. [online] AnalyzeCore by Sergey Bryl’ - data is beautiful, data is a story. Available at: link [Accessed 23 Oct. 2018].